Creating effective compliance dashboards at the department level is crucial for organizations aiming to meet accreditation standards and conduct thorough internal audits. Totara Learn v20 offers a robust platform that enables users to design and implement these dashboards with ease. This article will guide you through the key features of Totara Learn v20, the design principles for effective dashboards, and the best practices for tracking compliance metrics. By understanding how to leverage Totara Learn v20’s capabilities, organizations can enhance their reporting processes and ensure they meet necessary compliance requirements. We will explore the reporting features, design strategies, integration tools, and visualization techniques that can significantly improve compliance tracking and reporting.
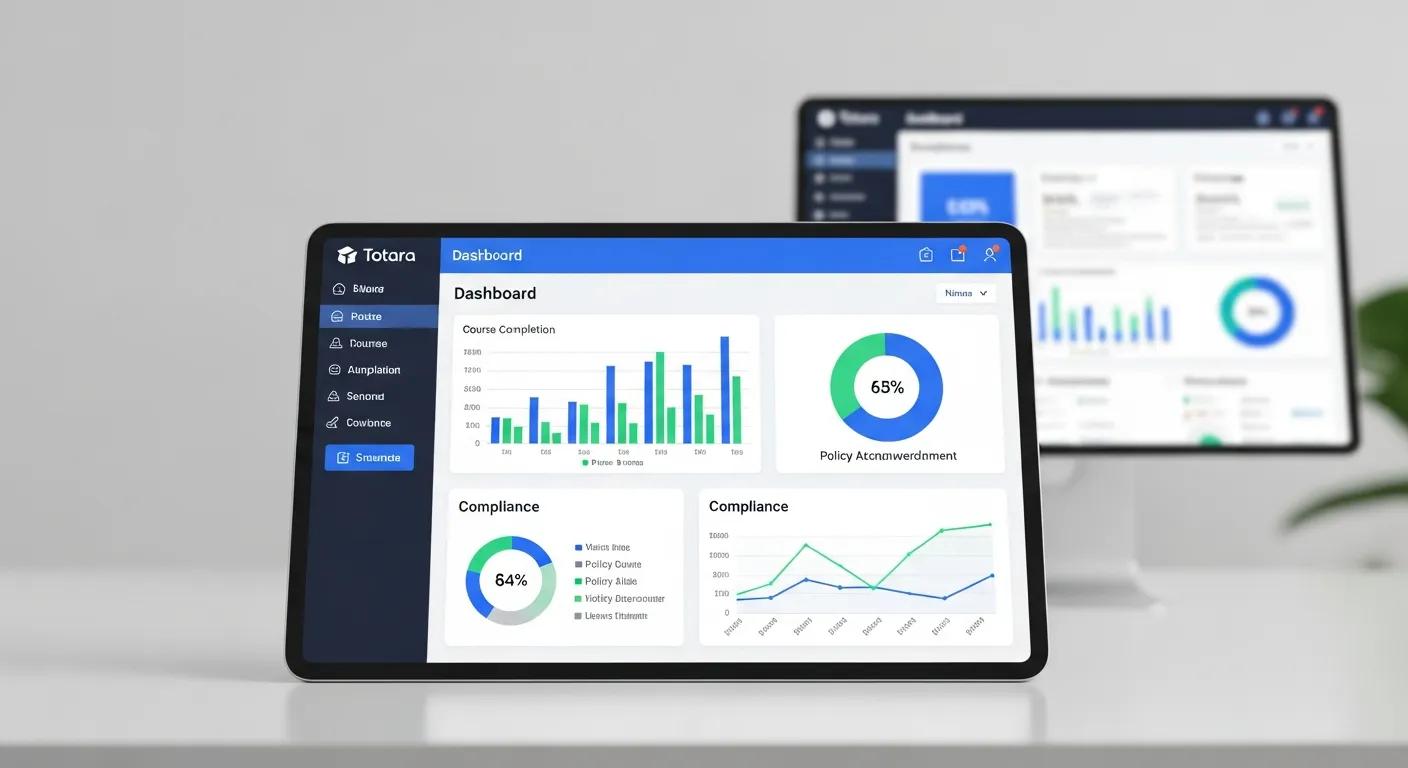
Totara Learn v20 provides a suite of reporting features that are essential for building effective compliance dashboards. These features include a customizable report builder, integration with various compliance metrics, and a user-friendly dashboard interface. The report builder allows users to create tailored reports that reflect specific compliance needs, making it easier to track and analyze data relevant to accreditation reviews and internal audits.
The report builder in Totara Learn v20 is designed to facilitate the creation of custom dashboards by allowing users to select specific data points and metrics that are most relevant to their compliance needs. Users can follow a step-by-step process to create reports, which includes selecting data sources, defining filters, and choosing visualization options. This flexibility ensures that dashboards can be tailored to meet the unique requirements of different departments, enhancing the overall effectiveness of compliance tracking.
Totara Learn v20 integrates with various analytics and visualization tools that enhance compliance reporting. These tools provide advanced data analysis capabilities, allowing users to visualize compliance metrics in meaningful ways. For instance, users can create graphs, charts, and tables that present data clearly and concisely. The integration of these tools not only improves the aesthetic appeal of dashboards but also aids in the quick interpretation of compliance data, making it easier for stakeholders to make informed decisions.
Designing effective compliance dashboards requires careful consideration of several key principles. First, dashboards should be user-centric, focusing on the needs and preferences of the end-users. Second, the design should prioritize clarity and simplicity, ensuring that users can easily navigate and interpret the information presented. Lastly, incorporating interactive elements can enhance user engagement and facilitate deeper data exploration.
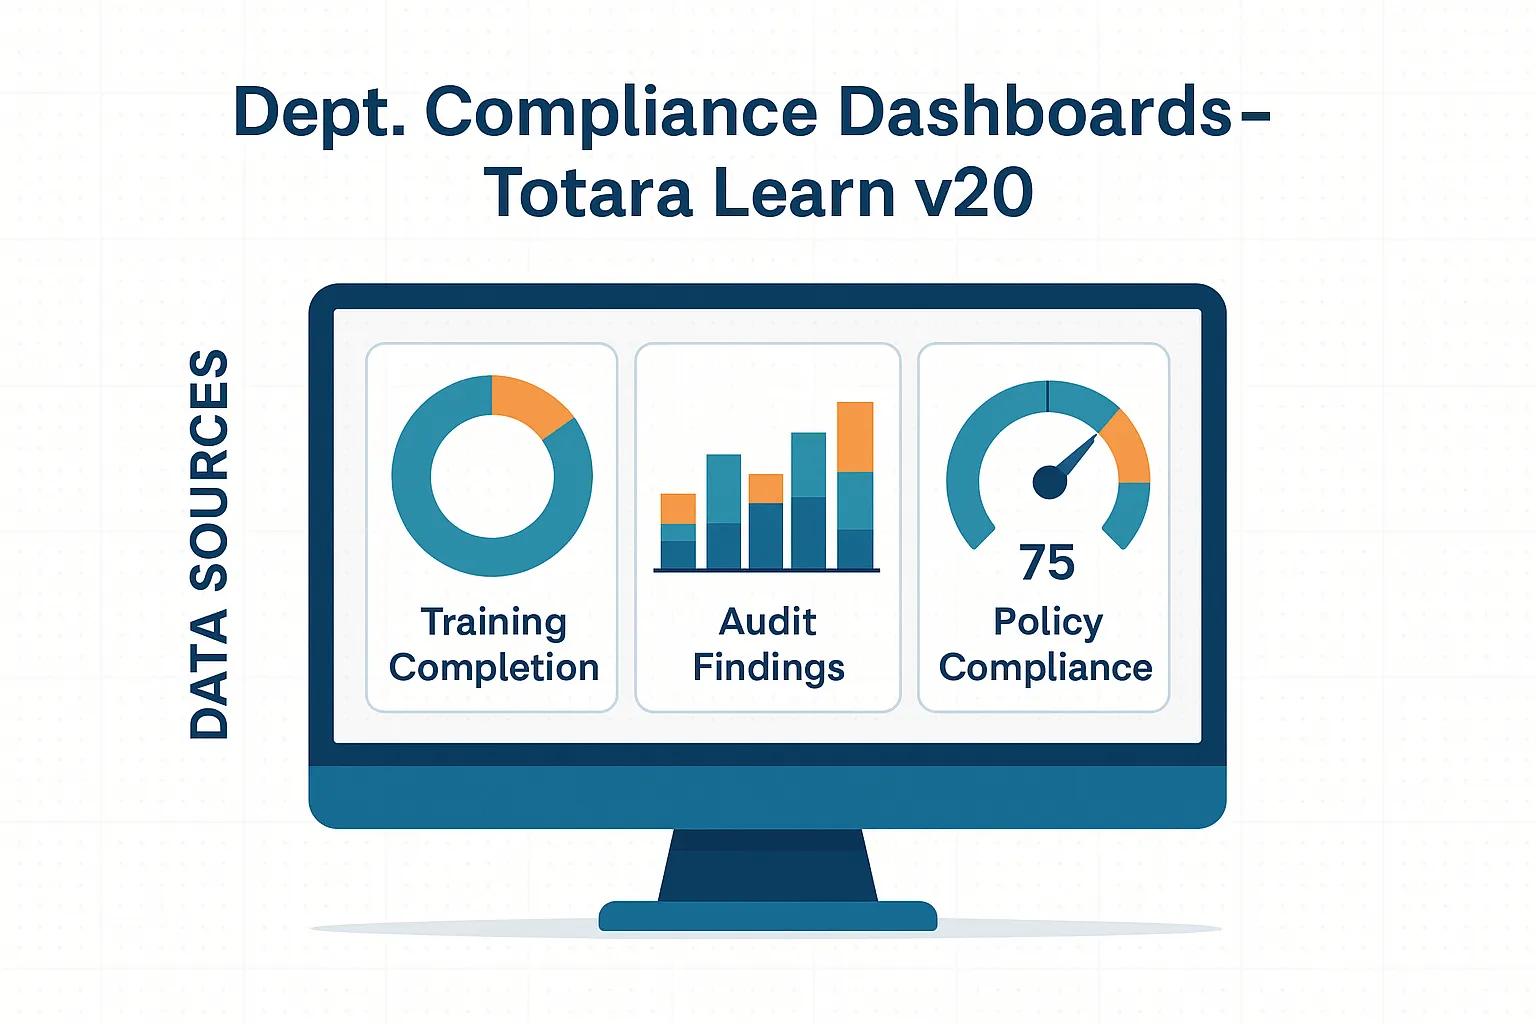
When designing compliance dashboards for accreditation reviews, it is essential to include specific metrics that reflect the organization’s compliance status. Key metrics may include:
These metrics provide a comprehensive view of compliance efforts and help identify areas that require improvement.
Customizing dashboards for internal audit reporting involves tailoring the displayed metrics and visualizations to align with the specific objectives of the audit. Best practices for customization include:
By following these practices, organizations can ensure that their dashboards effectively support internal audit processes.
Totara Learn v20 supports integration with various accreditation review tools that enhance the functionality of compliance dashboards. These tools can streamline the accreditation process by providing additional data sources and reporting capabilities.
Aligning dashboard metrics with healthcare accreditation standards is crucial for ensuring compliance. Organizations should focus on key healthcare accreditation standards, such as:
By aligning dashboard metrics with these standards, organizations can better prepare for accreditation reviews and demonstrate their commitment to quality care.
To effectively use Totara Learn v20 in formal accreditation evaluations, organizations should adopt several best practices:
These practices can enhance the effectiveness of Totara Learn v20 in supporting accreditation evaluations.
Tracking and reporting healthcare compliance training is a critical function of compliance dashboards. Totara Learn v20 offers features that facilitate the monitoring of training completion and effectiveness, ensuring that organizations meet their compliance obligations.
Essential KPIs for tracking healthcare training compliance include:
These KPIs provide valuable insights into the effectiveness of training programs and help identify areas for improvement.
Totara Learn v20 allows organizations to generate detailed reports that monitor training completion and effectiveness. Users can create reports that analyze completion rates, assess performance on training assessments, and track trends over time. This data is crucial for making informed decisions about training programs and ensuring compliance with regulatory requirements.
Effective data visualization is key to enhancing compliance insights. Totara Learn v20 provides various tools and techniques for visualizing compliance data in a way that is both informative and engaging.
To enhance compliance insights through data visualization, organizations should consider the following techniques:
These techniques can significantly improve the clarity and impact of compliance data presentations.
Key components that improve real-time audit and accreditation monitoring include:
Incorporating these components can enhance the effectiveness of compliance dashboards in supporting real-time monitoring efforts.
Creating effective department-level compliance dashboards in Totara Learn v20 is a smart way for organizations to improve compliance management, support accreditation readiness, and simplify internal audit processes. With Totara Learn v20 reporting tools, customizable dashboards, and data visualization features, teams can track training completion, monitor regulatory requirements, and gain clearer insight into department-level performance. A well-designed compliance dashboard in Totara Learn not only improves reporting accuracy but also helps organizations reduce risk, strengthen accountability, and maintain continuous compliance across multiple teams and learning programs.
For organizations looking to optimize Totara Learn v20 for compliance reporting, Markanyx provides expert support tailored to your goals. As an official Totara partner, Markanyx helps organizations implement, customize, and enhance Totara Learn dashboards, reports, and learning workflows to align with compliance, certification, and accreditation requirements. Contact Markanyx to improve your Totara Learn v20 compliance dashboard strategy and build a more efficient, data-driven learning environment.